Farmland Values: North Carolina Ticks Up (Mostly) From 2018
go.ncsu.edu/readext?615909
en Español / em Português
El inglés es el idioma de control de esta página. En la medida en que haya algún conflicto entre la traducción al inglés y la traducción, el inglés prevalece.
Al hacer clic en el enlace de traducción se activa un servicio de traducción gratuito para convertir la página al español. Al igual que con cualquier traducción por Internet, la conversión no es sensible al contexto y puede que no traduzca el texto en su significado original. NC State Extension no garantiza la exactitud del texto traducido. Por favor, tenga en cuenta que algunas aplicaciones y/o servicios pueden no funcionar como se espera cuando se traducen.
Português
Inglês é o idioma de controle desta página. Na medida que haja algum conflito entre o texto original em Inglês e a tradução, o Inglês prevalece.
Ao clicar no link de tradução, um serviço gratuito de tradução será ativado para converter a página para o Português. Como em qualquer tradução pela internet, a conversão não é sensivel ao contexto e pode não ocorrer a tradução para o significado orginal. O serviço de Extensão da Carolina do Norte (NC State Extension) não garante a exatidão do texto traduzido. Por favor, observe que algumas funções ou serviços podem não funcionar como esperado após a tradução.
English
English is the controlling language of this page. To the extent there is any conflict between the English text and the translation, English controls.
Clicking on the translation link activates a free translation service to convert the page to Spanish. As with any Internet translation, the conversion is not context-sensitive and may not translate the text to its original meaning. NC State Extension does not guarantee the accuracy of the translated text. Please note that some applications and/or services may not function as expected when translated.
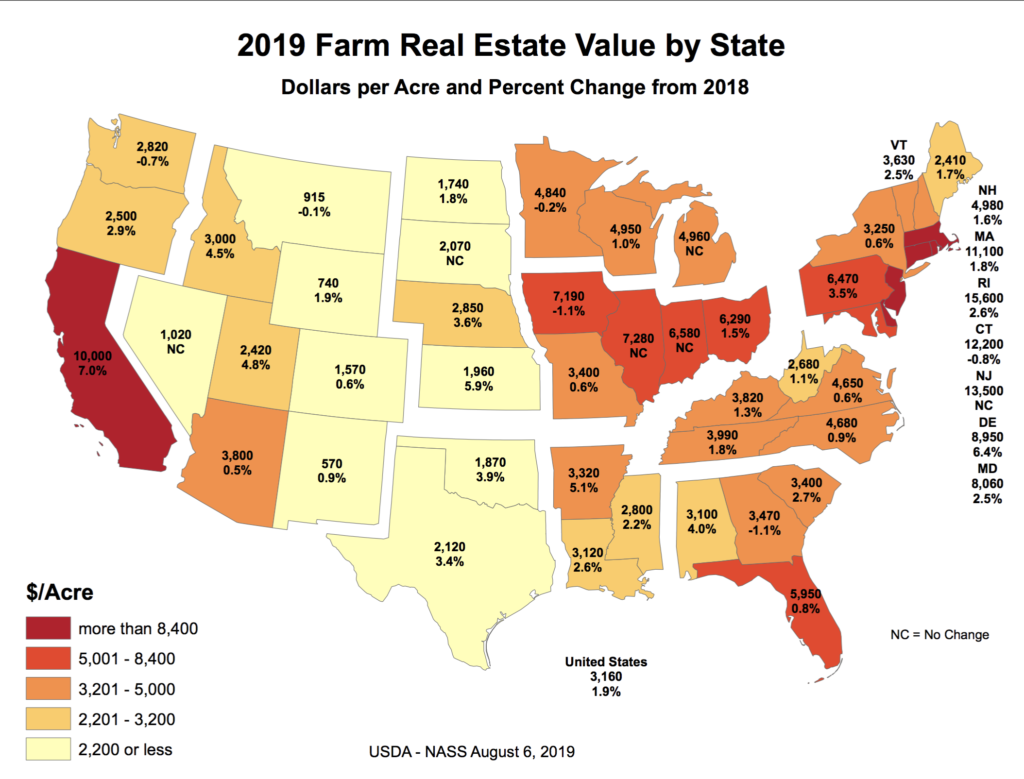
Collapse ▲The recent National Agricultural Statistics Service (NASS) posted the results of its early June survey on various categories of farmland values to show a national increase of 1.9% for an average real estate value of $3160 per acre. The categories of land attributes surveyed are real estate, cropland, irrigated land, and pasture land. (North Carolina is not surveyed for irrigated land value.) NASS defines a farm as “[a]ny establishment from which $1,000 or more of agricultural products were sold or would normally be sold during the year” (including government payments).
North Carolina’s results are as follows:
Real Estate Value: $4680 (.09% increase from 2018). This average value has remained relatively flat since the 2014 value of $4510. NASS defines this valuation as “[t]he value at which all land and buildings used for agriculture production including dwellings, could be sold under current market conditions if allowed to remain on the market for a reasonable amount of time.”
Crop Land Value: $4180 (1.2% increase from 2018). Likewise, values have continued to fall below the 2014 high value of $4200. NASS defines this metric as “[t]he value of land used to grow field crops, vegetables, or land harvested for hay.” This category includes idle land and land enrolled in USDA programs.
Pasture Land Value: $4810 (down 0.8% from 2018). The five-year highest value was 2014 at $4,760. Pasture land is defined as “land that is normally grazed by livestock.”
Overall, values in the three categories have remained relatively flat for the past five years, gradually dropping. As noted above, real estate and cropland have ticked upward, with pasture continuing to droop downward.
Nationally, California had the largest increase (7%, $10,000/ac) from 2018, with Delaware next (6.4%, $8950), then Kansas (5.9%, $1960), Arkansas (5.1%, $3320), and Utah (4.8%, $2420) and Idaho (4.5%, $3000).
Regionally, South Carolina’s real estate value increased by 2.7% ($3400/ac) and Virginia’s by 0.6% ($4650). Virginia’s cropland value declined 0.8% to $4720. Pasture land declined in Virginia, Tennessee and South Carolina.


